Tableau Resource
Learning Tableau
Books
- Practical Tableau.
In processing, I’m hoping i can finish reading it first time by the end of April, 2021.
- Tableau for Dummies.
Easy book introduces the basic features of tableau. Already finished.
Hands on practice
Type of charts in Tableau
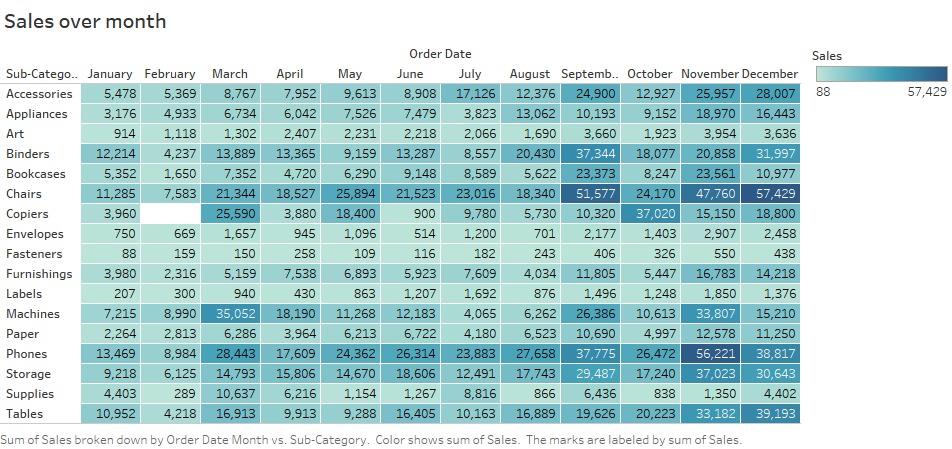
Highlight Table
Highlight table consists of one or more dimensions and exactly one measure (the color). It helps visualize highs and lows in the data with the color mark, compared to crosstab, it is more efficient.
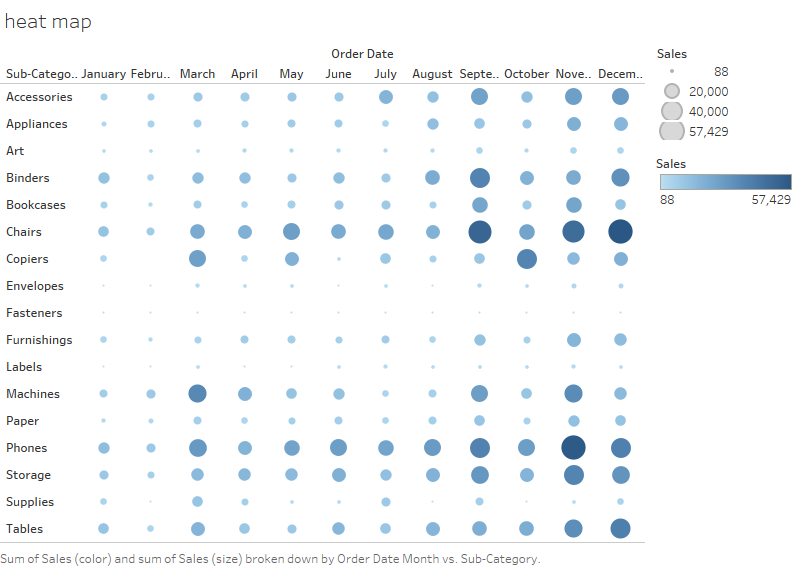
Heat Map
Heat map are a visualization where marks on a chart are represented as colors. As the marks heat up due to their higher values and density of records, a intense color is displayed. It is similar to highlight table, only heat map can include two measures.
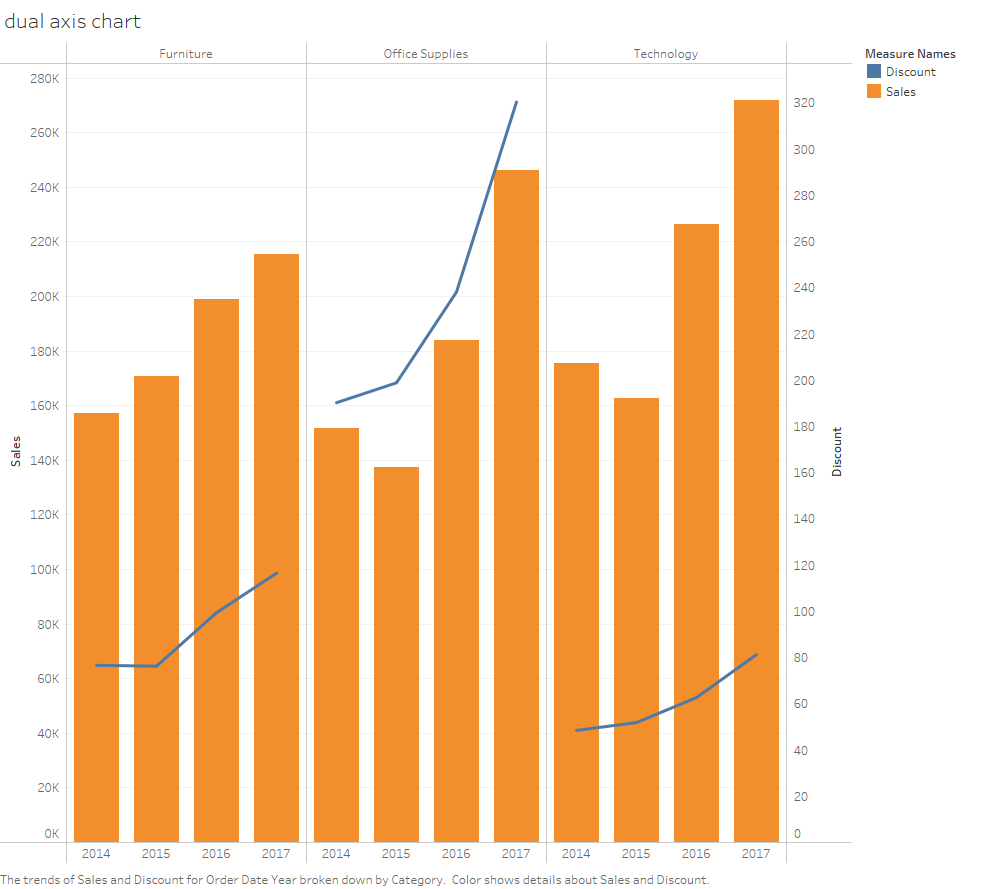
Dual-Axis Combination Chart
Dual Axis chart is a effective chart type for showing related information while saving real estate by combining views.
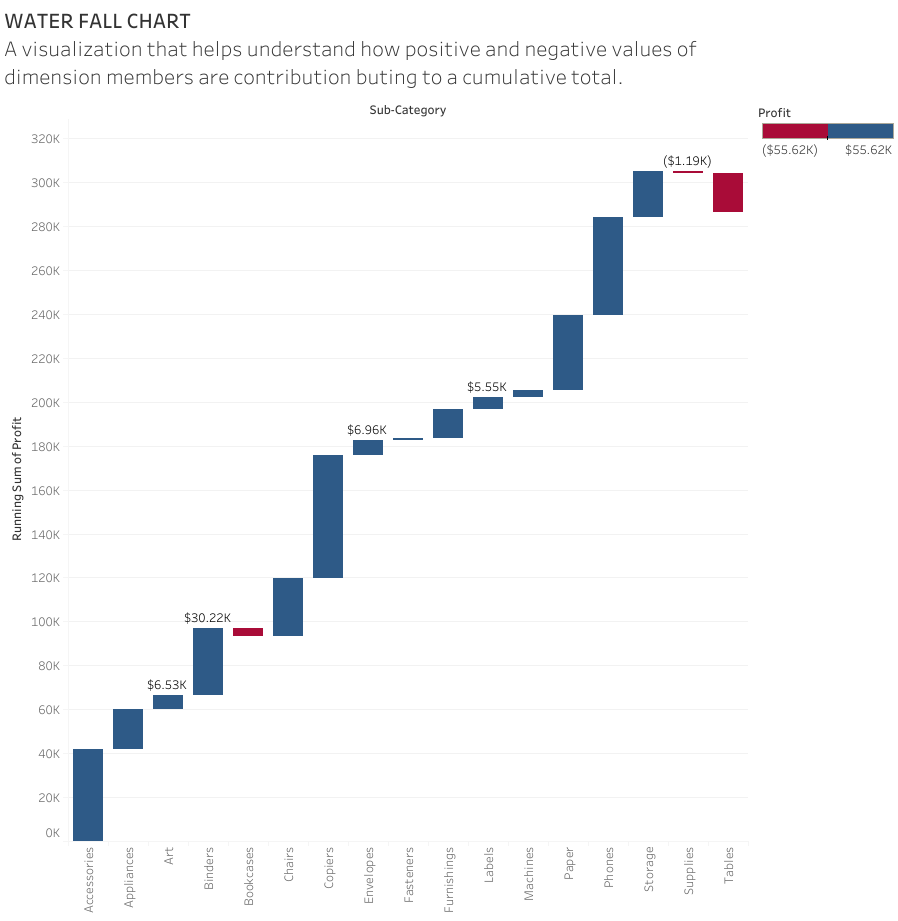
Water Fall Chart
A visualization that helps understand how positive and negative values of dimension members are contributing to a cumulative total.
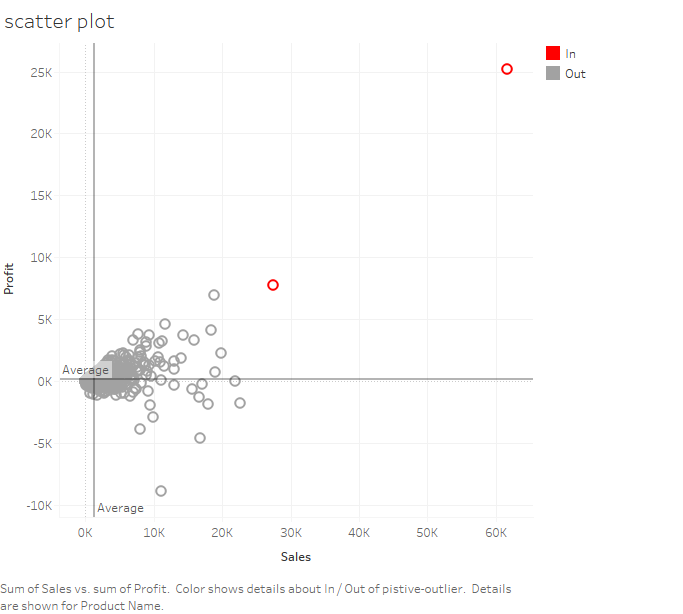
Scatter
Scatter plot is a visualization that displays the relationship between two measures, in addition to that, up to three measures and/or dimensions can be leveraged with the color and/or size and/or shape marks.
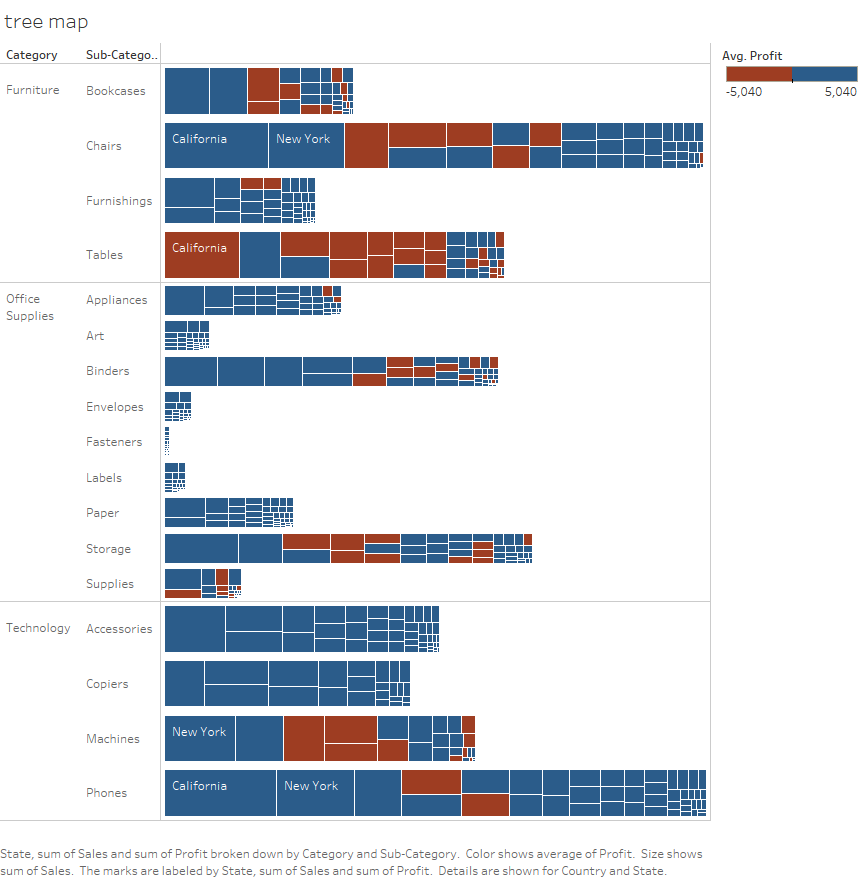
Tree Map
Tree map is a visualization that nests rectangles in heirarchies so we can compare different dimension combinations across one or two measures (one for size and one for color) and quickly interpret their respective contributions to the whole.
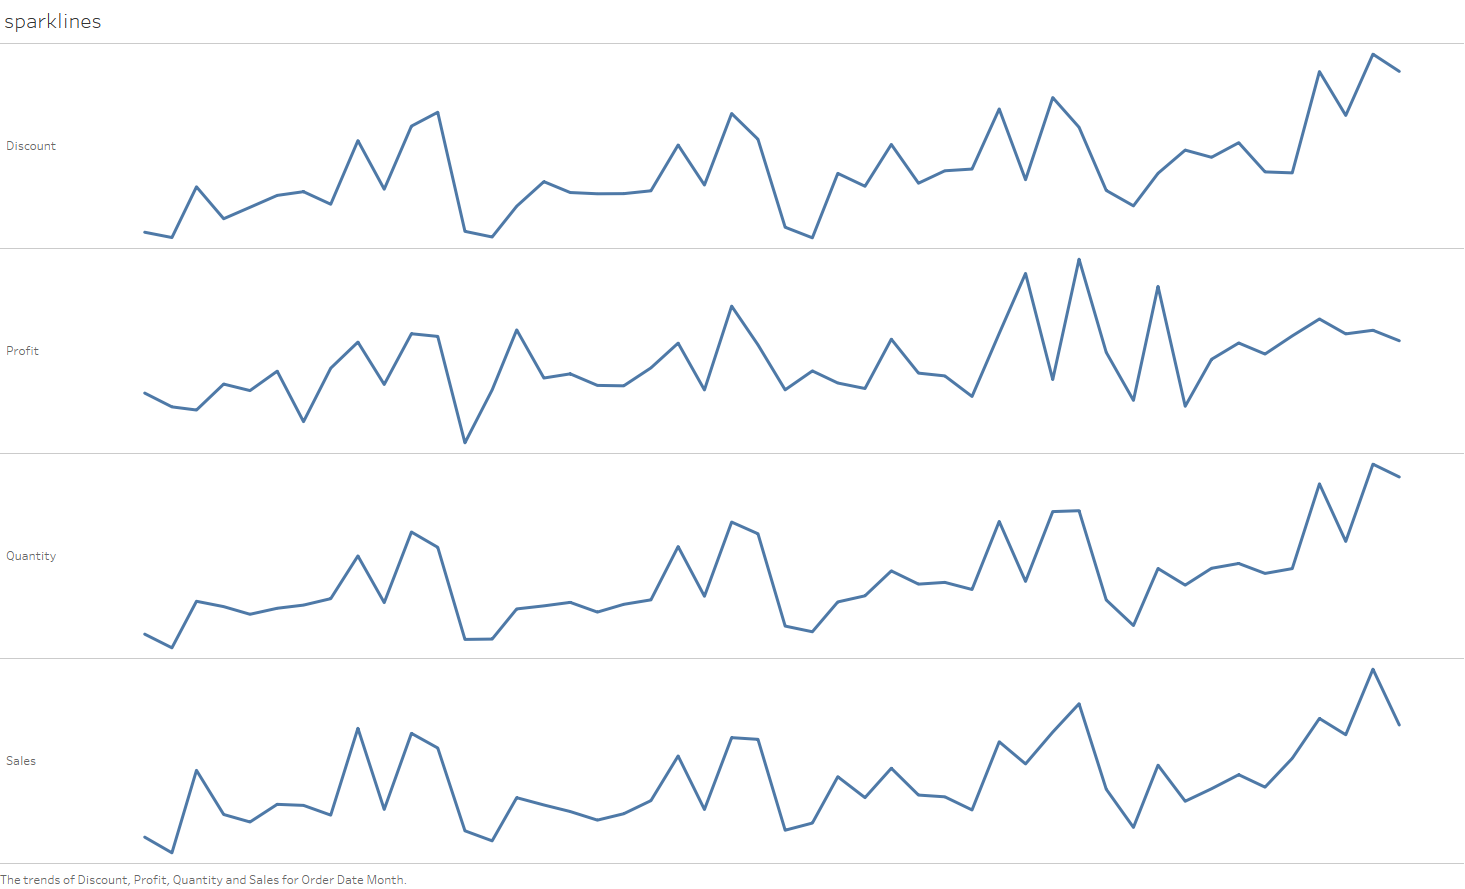
Sparklines
Sparklines are condensed graphs or charts that can be used in-line with text or grouped to show trends across different measures. It is an effective corporate chart types for qucikly communicating trends across KPIs.
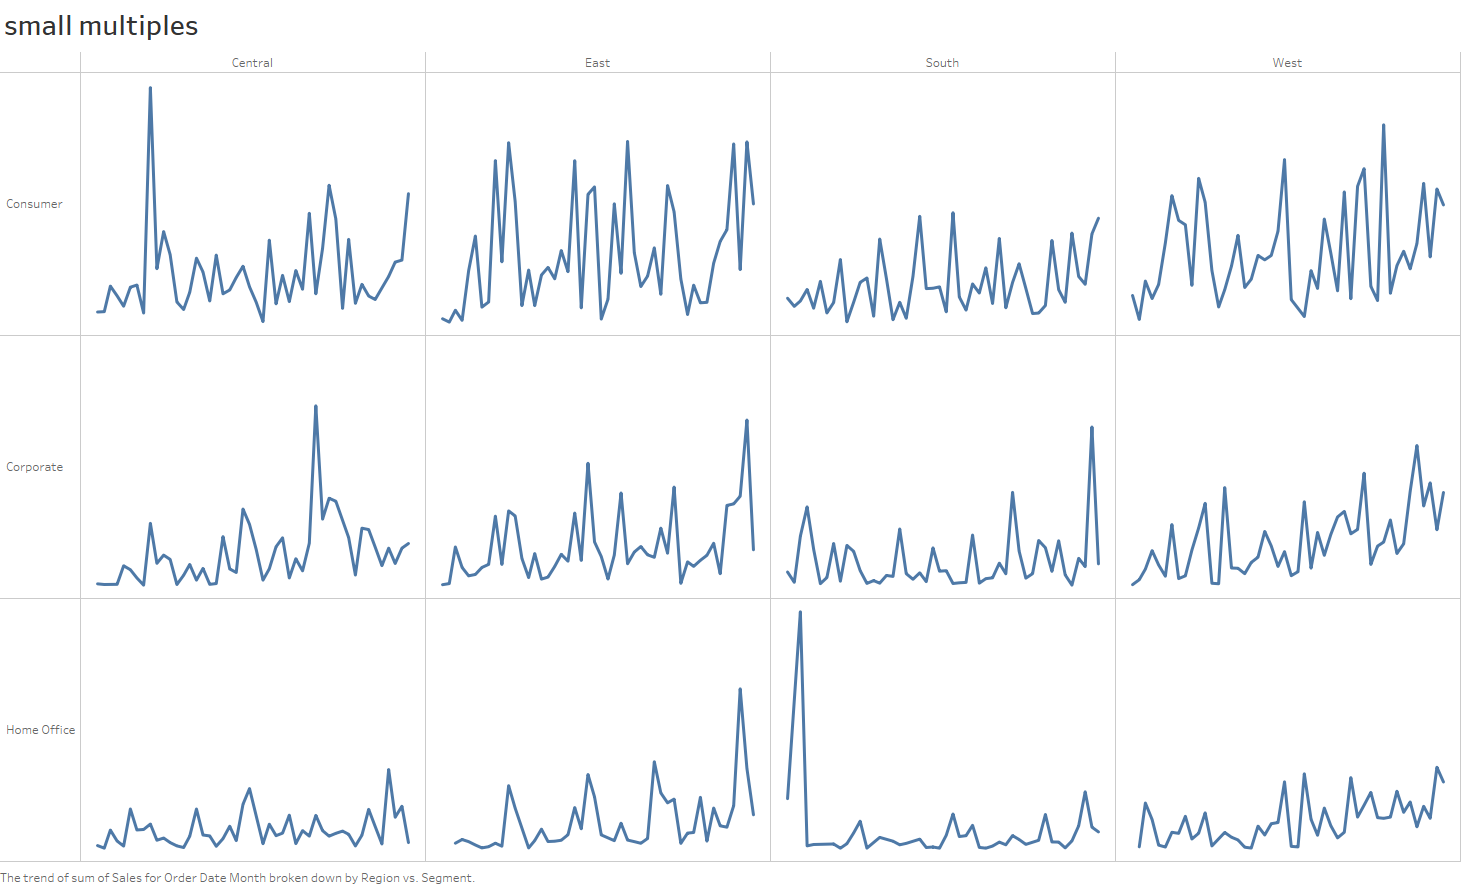
Small multiples
Small multiples are a group of charts or graphs that share the same axes and scales, which allows the user to compare trends across dimensions in a single view.
Bullet Graphs
Stacked Area Chart
Histogram
Box-and-Whisker Plot
Symbol Map
Filled map
Dual-axis Map
This type of map is useful any time when you want to combine two maps into one to help provide additional context that would not be available when showing one map.